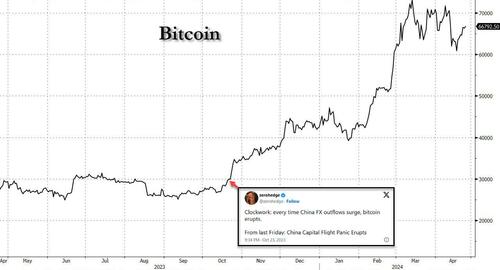
Chinese FX Outflows Soar To Highest Since 2015 Devaluation, Priming Next Bitcoin Surge
Last October, when we pointed out that China’s FX outflows had just hit a whopping $75BN – the single biggest monthly outflow since the 2015 currency devaluation – we concluded that the “unfavorable interest rate spread between China and the US will “likely imply persistent depreciation and outflow pressures in coming months”, or in other words, September’s biggest FX outflow in years is just the beginning, and very soon – in addition to geopolitics and central banks – the world will also be freaking out about the capital flight out of China… not to mention where all those billions in Chinese savings are going and which digital currency the Chinese are using to launder said outflows.”
We wrote that on October 20 when Bitcoin was trading just under $30,000, a level it had been for much of 2023. And, just as we correctly predicted at the time…
Clockwork: every time China FX outflows surge, bitcoin erupts.
From last Friday: China Capital Flight Panic Eruptshttps://t.co/j0eWLnbFMq
— zerohedge (@zerohedge) October 24, 2023
… following this surge in Chinese FX outflows, bitcoin – traditionally China’s preferred means to circumvent Beijing’s great capital firewall since gold is, how should one put it, a bit more obvious when crossing borders – promptly exploded more than 100% higher in the next 4 months.
And while conventional wisdom is that this surge in the price of the digital currency was largely due to the January launch of Bitcoin ETFs, what many missed was a Reuters story in January which reiterated our original thesis from back in 2015, according to which much more than ETFs, and much more than rapidly shifting sentiment or frankly any day-to-day newsflow, it is China’s massive wall of inert capital that has been the biggest driver of bitcoin moves, and never more so than during periods of FX and capital outflows which usually precede some form of capital controls.
We bring all this up because seven months after our first correct prediction that China’s spike in FX outflows would send bitcoin surging, it’s time to do it again.
One wouldn’t know it, however, if one merely looked at the official Chinese FX reserve data published by the PBOC, here nothing sticks out. In fact, at $3.2 trillion, despite a rather notable drop for April, reported Chinese reserves are now near the highest level in past four years, and monthly flows are very much stable as shown in the chart below.
The problem, of course, is that as we have explained previously China’s officially reported reserves are woefully (and purposefully) inaccurate of the bigger picture.
Instead if one uses our preferred gauge of FX flows, one which looks at i) onshore outright spot transactions; ii) freshly entered and canceled forward transactions, and iii) the SAFE dataset on “cross-border RMB flows, we find that China’s net outflows were a massive $86BN in April, up from $11BN in February and $39BN in March and the fastest pace of outflows since the September spike in FX outflows which we duly noted half a year ago.
Drilling down, in April, we saw $50BN in net outflows via onshore outright spot transactions, and $1BN outflows via freshly entered and canceled forward transactions. Another SAFE dataset on “cross-border RMB flows” showed outflows of $35bn in the month, suggesting net receipt of RMB from onshore to offshore, likely on the back of Stock Connect outflows, but the “unusual flow” really could be anything including the unexplained capital flight into gold and bitcoin. Ours – and Goldman’s – preferred FX flow measure therefore suggests FX outflows were really $86BN in April, more than double the official net FX outflows of $39BN in the month.
How did we get this number? First, the portfolio investment channel showed net outflows in March after adjusting for cross-border RMB receipts. Stock Connect flows showed around US$9bn outflows, vs. US$8bn outflows in March. Foreigners kept buying RMB bonds – the bond market saw US$7bn inflows in April, vs. US$6bn in March.
Finally, the current account channel also showed faster net outflows. Despite a sizeable goods trade surplus in April, we saw a small outflow of $2bn related to goods trade in April vs. an inflow of $14bn in March. The services trade deficit widened to $22bn vs. $18bn in March. The income and transfers account showed outflows of $5bn in April, faster than the $2bn outflows in March.
At the time when FX outflows were re-acclererating, the broad USD strengthened further in April, and more importantly, the USDCNY spot drifted higher, as one would expect when there is capital flight... Oh, and Bitcoin traded at its record high above $70K.
And while Chinese policymakers are still keen on maintaining FX stability (or at least create that impression) as the countercyclical factors in the daily CNY fixing remained deeply negative and front-end CNH liquidity tightened notably in recent weeks, the reality is that with China desperate to boost its exports at a time when its great mercantilist competitor, Japan, has hammered the yen to the lowest level in 3 decades, it is only a matter of time before the currency devaluation advocates win, as they did in 2015.
We hope that we don’t have to remind readers that the first big trigger for bitcoin’s unprecedented eruption higher starting in 2015 was – you guessed it – China’s August 2015 FX devaluation, as we correctly noted at the time when we predicted that bitcoin would explode from $250 to the tens of thousands.
So don’t be surprised if in the next 6 months Bitcoin doubles again, and the move has nothing to do with ETF inflows, the halving, or frankly anything else taking place in the US… and instead is entirely driven by China’s massive wall of money which at last check was almost 3x bigger than the US.
Tyler Durden
Fri, 05/17/2024 – 11:20


Share This Article
Choose Your Platform: Facebook Twitter Linkedin